Cell Culture Media Identification in Biopharmaceuticals
Introduction
The quality of cell culture media used for the growth of cells under controlled conditions plays an important role in the efficiency of biopharmaceutical production. Cell culture conditions vary widely, including form factors—typically liquid or powder form—and in molecular makeup. These samples are most often complex mixtures of amino acids, sugars, salts, and vitamins, with some components in very high concentration while others are extremely low and variant. Analytical techniques for cell media also vary, as differentiating media types can be challenging. The biopharmaceutical industry strives for more understanding of the effect of media on cell health and batch success, and to limit the negative contribution of variance that may be sourced in their purchased cell culture media materials.
Handheld Raman spectroscopy for cell cuture media analysis
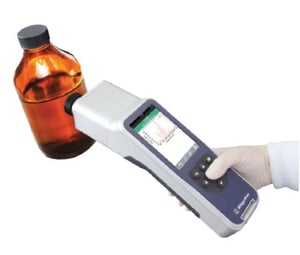
Handheld Raman spectrometers provide a nondestructive, reliable and cost-effective method for analyzing and identifying cell media, especially in powder form. Its ability to scan through packaging and transparent vessel windows makes it an ideal technology to use during biopharmaceutical manufacturing. Traditionally, handheld Raman analyzers have utilized 785 nm laser excitation. However, naturally occurring fluorescence interference is a common issue related to 785 nm Raman analyzers when scanning cell media, as shown in Figure 1. The 785 nm spectrum (represented in red) demonstrates significant fluorescence, making it difficult to obtain reliable and specific sample data. When utilizing a higher wavelength of 1064 nm, signal-blocking fluorescence is eliminated. The Rigaku Progeny 1064 nm handheld Raman analyzer generates higher quality, low-fluorescence data has the ability to distinguish between these types of compounds. Progeny provides a versatile solution for users to create simple qualitative models quickly and easily—right on the instrument—in order to differentiate certain media from another, or to easily gather bountiful at-line data for more complex secondary cluster-type models.
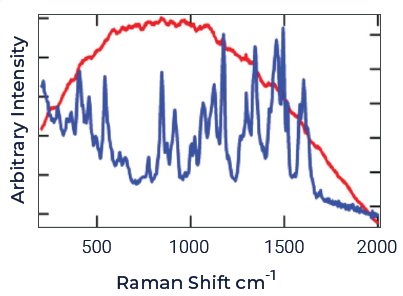
Figure 1: Spectra of synthetic cell culture media from a handheld 785 nm Raman analyzer (red) and a 1064 nm Raman analyzer (blue).
Case study
A selection of common media powders were scanned with a handheld Rigaku Progeny 1064 nm Raman analyzer and further studies were done to determine selectivity of a potential library. The spectra shown are of four common cell media powders in Figure 2.
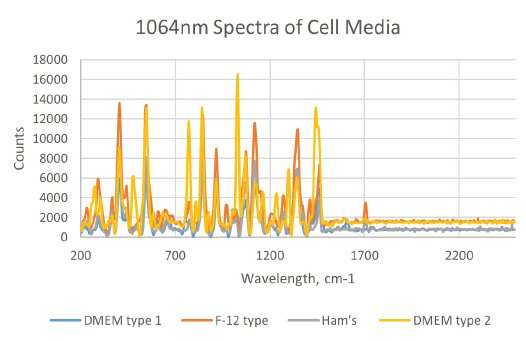
Figure 2: Spectra of four common media powders scanned with the Progeny 1064 nm handheld Raman.
Table 1: Correlation mapping of four cell media powders.
| DMEM type 1 | F-12 type | Ham's | DMEM type 2 | |
| DMEM type 1 | 1.00 | |||
| F-12 type | 0.93 | 1.00 | ||
| Ham's | 0.91 | 0.97 | 1.00 | |
| DMEM type 2 | 0.62 | 0.58 | 0.57 | 1.00 |
Correlation mapping of the cell media powders gave an idea of the selectivity of these materials shown in Table 1.
In this example, the user is able to create a model directly on Progeny, and set a threshold cutoff cc value of 0.95. This would allow for potential differentiation of the cell media powders with one exception – the two materials that are the hardest to differentiate are both similar composition materials. However, one material contains arginine and sodium pyruvate, and the other does not. Therefore, while spectrally the two materials are very similar, a visual inspection does show two peaks that may be useful in differentiation. A spectral overlay done directly on Progeny of the two materials, shows peaks are present due to the primary and secondary amines of arginine.
L-arginine has a characteristic band at 970 cm⁻¹ associated with C-N stretching. Also note, characteristic bands due to the CH₂NH₂ are also present at the 1400 cm⁻¹ region (see Figure 3). It is possible that the two peaks due to the amines can be used to differentiate the two closely related cell media, based on a visual examination of the two spectra.
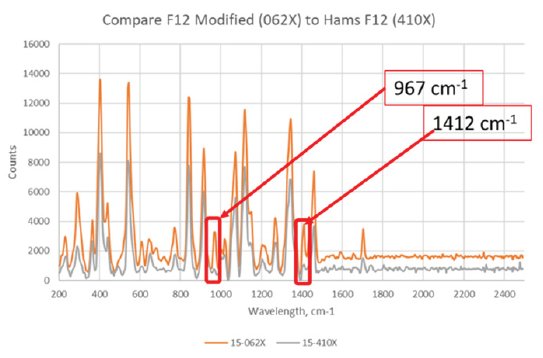 Figure 3: L-arginine has a characteristic band at 970 cm⁻¹ associated with C-N stretching. Also note, CH₂NH₂ is also present at the 1400 cm⁻¹ region.
Summary
Handheld Raman instruments are a valuable and well-recognized tool for cell culture media analysis in the biopharmaceutical industry. With the use of a Rigaku 1064 nm handheld Raman analyzer, the common issue of fluorescence interference is overcome. In addition, Progeny provides a versatile tool with enhanced features that allows it to be used for more than just material identification. This example shows the enhanced features available for spectral comparison, not only based on correlation, but also to compare two closely related materials and assess peak differences. Because of this, the Rigaku Progeny can be effectively utilized as a part of a complete quality analysis process in the biopharmaceutical industry.
_Page_1.jpg?width=250&height=354&name=2093822_RAD%20Cell%20Media_AN_R4%20(1)_Page_1.jpg)

Contact Us
Whether you're interested in getting a quote, want a demo, need technical support, or simply have a question, we're here to help.