Quantitative Analysis of Dolomite and Limestone by Pressed powder Method with Supermini200
Introduction
Both dolomite and limestone are important mineral resources used in various industries such as cement, electronics, iron manufacturing, glass, paper and pulp, agriculture. Each industry has particular interests in contents and components. For example in the cement industry, dolomite and limestone are sources of Ca. In iron manufacturing, Ca acts as an absorber of impurities like Si, S and P, and Mg protects the furnace walls from corrosive elements like S and P. In the glass industry, low content of Fe is preferred because Fe can color glass.
X-ray fluorescence (XRF) analysis quickly and easily offers precise elemental analysis results allowing control of the components in the product during the manufacturing process.
This application note demonstrates the excellent performance of Supermini200 for the analysis of dolomite and limestone.
Instrument
The Supermini200 is a benchtop sequential wavelength dispersive XRF (WDXRF) spectrometer designed specifically to deliver excellent performance while eliminating conventional installation requirements such as cooling water, special power supply and large floor space. By selecting the optional sealed proportional counter instead of the gas flow proportional counter, requirement of P10 gas can be eliminated as well, realizing a truly utility free WDXRF instrument. Featuring a unique air-cooled 200W X-ray tube, two detectors, three analyzing crystals with selectable vacuum or helium environment, the Supermini200 can analyze elements from oxygen to uranium.
The Windows®-based software used to operate the Supermini200 shares the same platform running Rigaku’s popular high-power WDXRF ZSX family instruments. This means that it has the same advanced algorithms, multiple language support and an intuitive user-friendly interface.
Sample Preparation
The samples were ground in a tungsten carbide container for two minutes. The sample to binder ratio is 4.2 g to 0.42 g. Each ground sample mixed with binder (Chemplex Spectro Blend® No.660) was pelletized using an aluminum ring (inner diameter : 32 mm) under the pressure of 150 kN.
Measurement and calibration
Measurements were performed on the Supermini200 for SiO₂, Al₂O₃, Fe₂O₃, CaO, MgO, SO₃, Na₂O, K2O, TiO₂, P₂O₅ and MnO. Measurement conditions are shown in Table 1.
Table 1: Measurement conditions
| Element | Si | Al | Fe | Ca |
| Line | Kα | Kα | Kα | Kα |
| kV-mA | 50-4.00 | 50-4.00 | 50-4.00 | 50-4.00 |
| Primary Filter | OUT | OUT | OUT | OUT |
| Slit | Std | Std | Std | Std |
| Crystal | PET | PET | LiF(200) | PET |
| Detector | PC | PC | SC | PC |
| Time Peak (s) | 20 | 20 | 40 | 10 |
| BG (s) | 10x2 | 10x2 | 20 | 4x2 |
| Element | Mg | S | Na | K |
| Line | Kα | Kα | Kα | Kα |
| kV-mA | 50-4.00 | 50-4.00 | 50-4.00 | 50-4.00 |
| Primary Filter | OUT | OUT | OUT | Al40 |
| Slit | Std | Std | Std | Std |
| Crystal | RX25 | PET | RX25 | PET |
| Detector | PC | PC | PC | PC |
| Time Peak (s) | 40 | 40 | 40 | 40 |
| BG (s) | 10x2 | 20 | 20x2 | 20 |
| Element | Ti | P | Mn | |
| Line | Kα | Kα | Kα | |
| kV-mA | 50-4.00 | 50-4.00 | 50-4.00 | |
| Primary Filter | OUT | OUT | OUT | |
| Slit | Std | Std | Std | |
| Crystal | LiF(200) | PET | PET | |
| Detector | SC | PC | PC | |
| Time Peak (s) | 40 | 40 | 200 | |
| BG (s) | 10x2 | 10x2 | 100x2 |
The calibration curves were generated using dolomite and limestone standards shown below:
- National Institute of Standards and Technology (NIST) standards SRM1c and 88b
- Geological Survey of Japan, AIST (GSJ) standards JDo-1 and JLs-1
- Bureau of Analysed Samples Ltd. (BAS) standards BCS-CRM368 and 393.
- European Committee for Iron and Steel Standardization (ECISS) CRM782-1
In order to extend the calibration range, NIST cement standards SRM1881a, 1884a, 1885a, 1886a, 1887a, 1888a and 1889a were added for Na2O and SO3. Ma-trix correction was applied to the components except for SO3 and Na2O. The correction coefficients were calculated theoretically by the fundamental parameter (FP) method. The calibration curves are shown in Figure 1 and the calibration results are listed in Table 2.
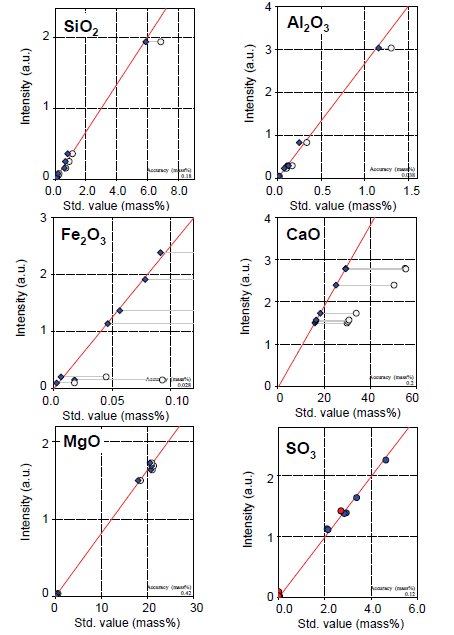
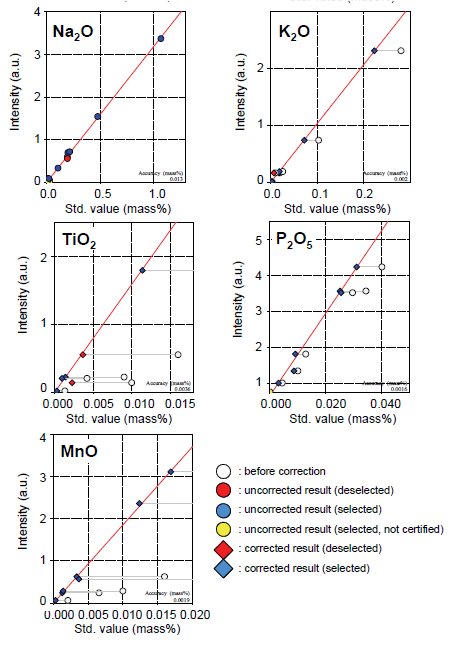
Figure 1: Calibration curves for dolomite and limestone
Table 2: Calibration results (unit : mass%)
| Component | Calibration range | Accuracy |
| SiO₂ | 0.12 - 6.84 | 0.18 |
| Al₂O₃ | 0.0174 - 1.3 | 0.038 |
| Fe₂O₃ | 0.0178 - 0.55 | 0.028 |
| CaO | 29.95 - 55.4 | 0.2 |
| MgO | 0.15 - 21.29 | 0.42 |
| SO₃ | 0.0397 - 4.622 | 0.12 |
| Na₂O | 0.00194 - 1.068 | 0.013 |
| K₂O | 0.00232 - 0.28 | 0.002 |
| TiO₂ | 0.00133 - 0.07 | 0.0036 |
| P₂O₅ | 0.0044 - 0.04 | 0.0016 |
| MnO | 0.00209 - 0.081 | 0.0019 |
The accuracy of the linear calibration curves are calculated by the following formula:
$Accuracy = \sqrt{ \frac{\sum_i{(C_i-\hat{C}_i)^2}}{n-2} }$
$C_i$: calculated value of standard sample
$\hat{C}_i$: reference value of standard sample
n : number of standard samples.
Analysis Results
Table 3: Repeatability test results for dolomite (unit : mass%)
| SiO₂ | Al₂O₃ | Fe₂O₃ | CaO | MgO | SO₃ | Na₂O | K₂O | TiO₂ | P₂O₅ | MnO | |
| Chemical value | 0.266 | 0.104 | 0.450 | 30.34 | 21.29 | 0.0397 | - | 0.0260 | 0.0042 | 0.0128 | 0.081 |
| N=1 | 0.2725 | 0.1153 | 0.4502 | 29.80 | 20.91 | 0.0395 | 0.034 | 0.0261 | 0.0043 | 0.0131 | 0.0793 |
| 2 | 0.2677 | 0.1155 | 0.4523 | 29.87 | 20.95 | 0.0390 | 0.048 | 0.0269 | 0.0037 | 0.0132 | 0.0788 |
| 3 | 0.2679 | 0.1202 | 0.4502 | 29.85 | 20.96 | 0.0403 | 0.046 | 0.0263 | 0.0041 | 0.0151 | 0.0793 |
| 4 | 0.2711 | 0.1190 | 0.4496 | 29.84 | 20.89 | 0.0404 | 0.036 | 0.0261 | 0.0038 | 0.0142 | 0.0793 |
| 5 | 0.2709 | 0.1161 | 0.4502 | 29.89 | 20.97 | 0.0403 | 0.033 | 0.0259 | 0.0044 | 0.0138 | 0.0795 |
| 6 | 0.2714 | 0.1214 | 0.4517 | 29.86 | 20.86 | 0.0397 | 0.047 | 0.0289 | 0.0043 | 0.0144 | 0.0796 |
| 7 | 0.2664 | 0.1175 | 0.4494 | 29.75 | 20.91 | 0.0406 | 0.043 | 0.0249 | 0.0041 | 0.0137 | 0.0788 |
| 8 | 0.2691 | 0.1182 | 0.4504 | 29.84 | 20.93 | 0.0408 | 0.034 | 0.0246 | 0.0041 | 0.0141 | 0.0794 |
| 9 | 0.2688 | 0.1161 | 0.4499 | 29.80 | 20.89 | 0.0410 | 0.048 | 0.0270 | 0.0040 | 0.0147 | 0.0795 |
| 10 | 0.2699 | 0.1175 | 0.4474 | 29.80 | 20.97 | 0.0410 | 0.039 | 0.0249 | 0.0045 | 0.0147 | 0.0794 |
| Avg. | 0.2696 | 0.1177 | 0.4501 | 29.83 | 20.92 | 0.0403 | 0.041 | 0.0262 | 0.0041 | 0.0141 | 0.0793 |
| Max. | 0.2725 | 0.1214 | 0.4523 | 29.89 | 20.97 | 0.0410 | 0.048 | 0.0289 | 0.0045 | 0.0151 | 0.0796 |
| Min. | 0.2664 | 0.1153 | 0.4474 | 29.75 | 20.86 | 0.0390 | 0.033 | 0.0246 | 0.0037 | 0.0131 | 0.0788 |
| Range | 0.0061 | 0.0061 | 0.0049 | 0.14 | 0.11 | 0.0020 | 0.015 | 0.0043 | 0.0008 | 0.0020 | 0.0008 |
| Std. dev. | 0.0019 | 0.0020 | 0.0013 | 0.04 | 0.04 | 0.0007 | 0.006 | 0.0013 | 0.0003 | 0.0007 | 0.0003 |
| RSD % | 0.71 | 1.74 | 0.29 | 0.14 | 0.17 | 1.66 | 15.15 | 4.85 | 6.15 | 4.66 | 0.35 |
Table 4: Repeatability test results for limestone (unit : mass%)
| SiO₂ | Al₂O₃ | Fe₂O₃ | CaO | MgO | SO₃ | Na₂O | K₂O | TiO₂ | P₂O₅ | MnO | |
| Chemical value | 0.12 | 0.0207 | 0.0178 | 55.09 | 0.606 | 0.0307 | 0.00194 | 0.00297 | 0.002 | 0.0295 | 0.00209 |
| N=1 | 0.1222 | 0.0249 | 0.0165 | 54.23 | 0.51 | 0.0288 | N.D. | 0.0034 | 0.0024 | 0.0298 | 0.0025 |
| 2 | 0.1217 | 0.0238 | 0.0173 | 54.18 | 0.51 | 0.0300 | N.D. | 0.0027 | 0.0024 | 0.0297 | 0.0023 |
| 3 | 0.1236 | 0.0226 | 0.0174 | 54.32 | 0.52 | 0.0281 | N.D. | 0.0027 | 0.0026 | 0.0313 | 0.0023 |
| 4 | 0.1219 | 0.0255 | 0.0178 | 54.42 | 0.52 | 0.0299 | N.D. | 0.0034 | 0.0025 | 0.0307 | 0.0028 |
| 5 | 0.1205 | 0.0240 | 0.0167 | 54.28 | 0.51 | 0.0289 | N.D. | 0.0043 | 0.0026 | 0.0295 | 0.0024 |
| 6 | 0.1184 | 0.0257 | 0.0167 | 54.34 | 0.53 | 0.0288 | N.D. | 0.0038 | 0.0021 | 0.0288 | 0.0027 |
| 7 | 0.1218 | 0.0234 | 0.0165 | 54.32 | 0.51 | 0.0295 | N.D. | 0.0026 | 0.0022 | 0.0307 | 0.0026 |
| 8 | 0.1219 | 0.0242 | 0.0171 | 54.33 | 0.52 | 0.0290 | N.D. | 0.0035 | 0.0024 | 0.0298 | 0.0023 |
| 9 | 0.1202 | 0.0244 | 0.0164 | 54.18 | 0.53 | 0.0287 | N.D. | 0.0034 | 0.0021 | 0.0317 | 0.0027 |
| 10 | 0.1193 | 0.0234 | 0.0175 | 54.29 | 0.52 | 0.0281 | N.D. | 0.0031 | 0.0025 | 0.0310 | 0.0025 |
| Avg. | 0.1212 | 0.0242 | 0.0170 | 54.29 | 0.52 | 0.0290 | - | 0.0033 | 0.0024 | 0.0303 | 0.0025 |
| Max. | 0.1236 | 0.0257 | 0.0178 | 54.42 | 0.53 | 0.0300 | - | 0.0043 | 0.0026 | 0.0317 | 0.0028 |
| Min. | 0.1184 | 0.0226 | 0.0164 | 54.18 | 0.51 | 0.0281 | - | 0.0026 | 0.0021 | 0.0288 | 0.0023 |
| Range | 0.0052 | 0.0031 | 0.0014 | 0.25 | 0.02 | 0.0019 | - | 0.0017 | 0.0005 | 0.0029 | 0.0006 |
| Std. dev. | 0.0016 | 0.0010 | 0.0005 | 0.08 | 0.01 | 0.0007 | - | 0.0005 | 0.0002 | 0.0009 | 0.0002 |
| RSD % | 1.28 | 4.00 | 2.82 | 0.14 | 1.16 | 2.27 | - | 15.90 | 7.71 | 3.01 | 8.07 |
Repeatability tests for dolomite and limestone were carried out and the results are shown in Table 3 and 4. The standard deviations for both major and minor components are very small.
Conclusions
The results show that high precision analysis of elements in dolomite and limestone can be performed using the benchtop WDXRF spectrometer Supermini200. The calibration curves obtained using the theoretical alpha corrections show good linearity by pressed powder method for both major and trace components.
Supermini200 is a benchtop spectrometer with a small footprint and is able to be operated with only a wall power outlet. Since Supermini200 is not site-specific, it has the great advantage that it can be installed any-where, and is therefore particularly suited for mining sites or small laboratories.

Contact Us
Whether you're interested in getting a quote, want a demo, need technical support, or simply have a question, we're here to help.