Mapping and Small Spot Analysis with a General-Purpose XRF Spectrometer
Introduction
One feature of X-ray fluorescence (XRF) spectrometry is that a large area, as much as 30 mm in diameter, can be measured on the surface of a specimen, which appropriately represents an analysis sample.
On the other hand, there has been demand for the ability to measure small spots on the surface of a specimen (point analysis) or to obtain information concerning elemental distribution across the surface of a specimen (mapping analysis). Although there have been XRF spectrometers dedicated to point or mapping analysis available in the market, it has not been possible to also perform large area analysis with these models.
Rigaku ZSX Primus IV and ZSX Primus IVi general purpose wavelength dispersive XRF (WDXRF) spectrometers can perform point and mapping analysis.
This application note demonstrates the point and mapping analysis function of ZSX Primus IV / Primus IVi by analyzing a granitic rock chip.
Instrument
ZSX Primus IV / Primus IVi have a six-position diaphragm changer with analysis areas 0.5, 1, 10, 20, 30 and 35 mm in diameter, and are capable of both small-spot and large-area analyses.
ZSX Primus IV / Primus IVi also have a sample stage that can move a specimen to a specified position.
In sequential WDXRF spectrometer, the X-ray tube is placed diagonally to the sample, as close to the sample as possible, in order to optimize the X-ray intensities of both the primary X-ray beam and fluorescent X-rays generated in the sample. Therefore, the distribution of the primary X-rays on the sample is not concentric. As shown in Figure 1, the center of the sample is not the point with the highest sensitivity; that point is shifted to the side for the X-ray tube.
In conventional XRF spectrometers, for small-spot analysis the measurement position is the center of the sample. Therefore, as shown in the right side of Figure 1, the X-ray intensity of the primary X-ray beam at the measurement position is almost half of the highest intensity.
On ZSX Primus IV / Primus IVi, for small-spot analysis the measurement position is set at the spot with the highest X-ray intensity. Since ZSX Primus IV / Primus IVi have a sample stage with r-θ driving, any position on the sample can be measured with the same sensitivity by moving the sample accordingly. Even spots near the rim of the measurement area have the same sensitivity.
ZSX Primus IV / Primus IVi have a MicroMapping function, where a digital image of the sample surface is captured making it possible to specify an analysis area, a line or spots on the captured image.
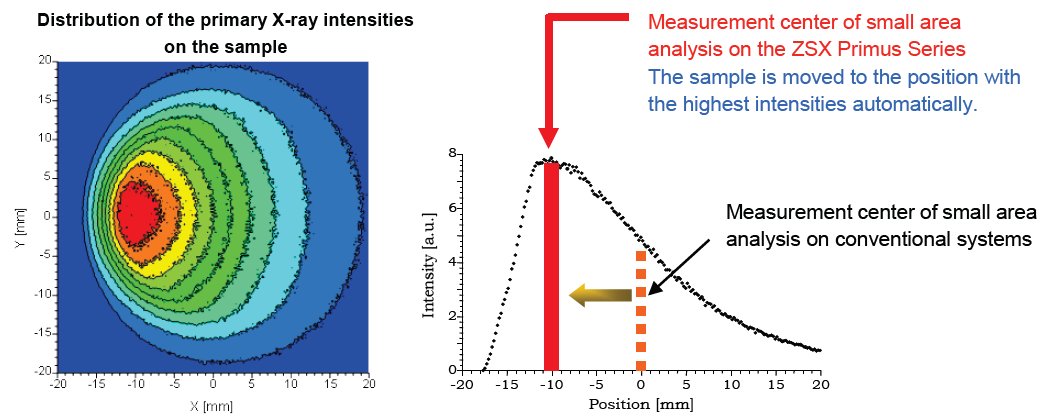
Figure 1: Distribution of the primary X-ray beam.
In MicroMapping with ZSX Primus IV / Primus IVi, the sample is moved by the sample stage, but the optics do not move; therefore, it is possible to perform qualitative, quantitative or semi-quantitative analysis with the same sensitivity for each spot in MicroMapping.
Measurement
A rock chip of granitoid was measured by MicroMapping with ZSX Primus IV. The rock chip is a remnant of a piece of granitic rock used for making a thin section.
The measurement spot size was 0.5 mm in diameter.
Analysis Results
Figure 2 shows a captured digital image of the granitoid sample. First, SQX analysis was carried out for four spots on the granitoid sample.
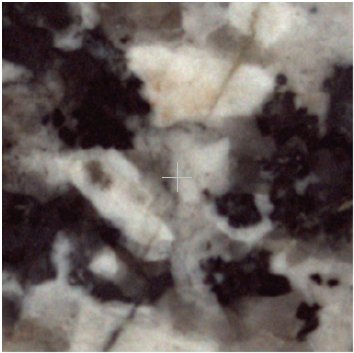
Figure 2: Captured digital image of the granitic rock sample.
Figure 3 shows the measured spots.
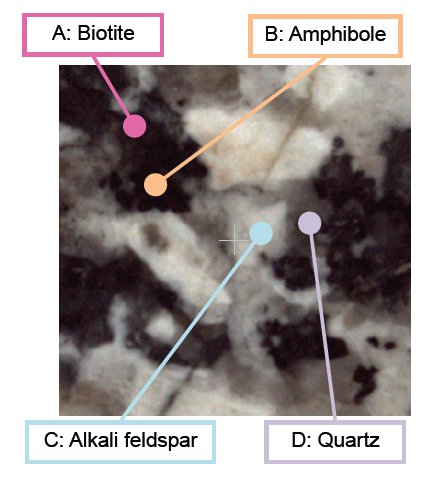
Figure 3: Position of the measured spots.
Table 1 shows SQX analysis results, which shows the results match the minerals at the measured spots.
Table 1: SQX result of the spots measured by MicroMapping.
| Component | Measured points (in mass%) | |||
| A | B | C | D | |
| Na₂O | - | - | 3.4 | - |
| MgO | 7.2 | 4.9 | - | - |
| Al₂O₃ | 12.1 | 7.9 | 19.4 | 0.46 |
| SiO₂ | 41.1 | 41.6 | 64.7 | 99.0 |
| P₂O₅ | - | 2.7 | - | - |
| K₂O | 2.6 | 1.9 | 10.8 | 0.10 |
| CaO | 0.92 | 6.7 | 1.2 | 0.05 |
| TiO₂ | 1.6 | 4.6 | - | - |
| MnO | 0.58 | 0.37 | - | - |
| Fe₂O₃ | 33.2 | 28.3 | 0.41 | 0.35 |
| Rb₂O | 0.04 | - | 0.03 | - |
| SrO | - | - | 0.03 | - |
| ZrO₂ | - | 0.85 | 0.03 | 0.02 |
Thus, the SQX results of the small spot analysis can help identify minerals in the area of the captured image.
Figure 4 shows qualitative charts for representative element lines. It is possible to visually compare the X-ray intensity of each spot.
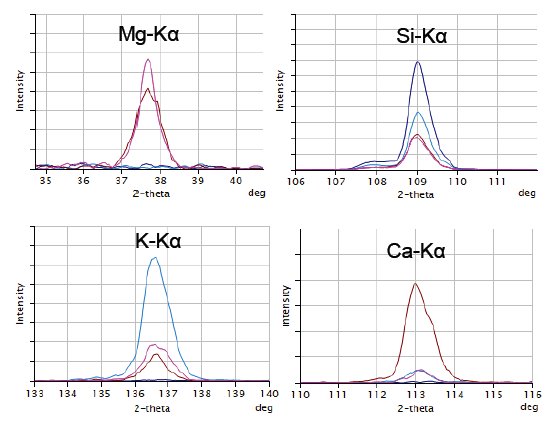 Figure 4: Qualitative chart of Mg-Kα, Si-Kα, K-Kα and Ca-Kα for the measured spots.
— A: biotite
— B: amphibole
— C: alkali feldspar
— D: quartz
Next, mapping analysis was carried out. The area indicated by a red rectangle in Figure 5 shows the area measured in the mapping analysis.
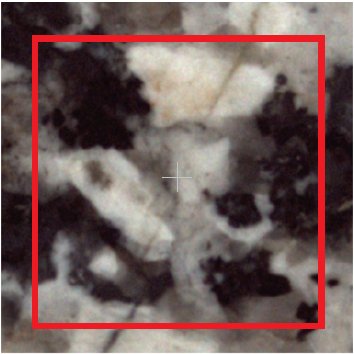
Figure 5: Analysis area of the mapping analysis.
Figure 6 shows mapping analysis results by a 2D viewer for X-ray intensities of Mg-Kα, Si-Kα, K-Kα and Ca-Kα lines.
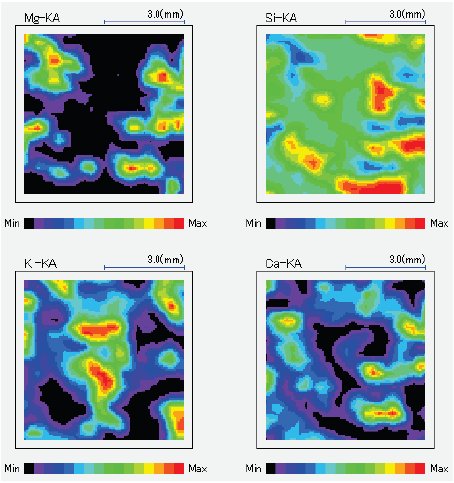
Figure 6: Mapping analysis results by 2D Viewer; X-ray intensities of Na, Mg, K and Fe Kα lines.
The analysis results show that the X-ray intensity distribution of each element matches minerals in the captured image.
Figure 7 shows Mg-Kα intensities by a 3D Bird Viewer. Mapping analysis results can be shown by a 2D or 3D viewer.
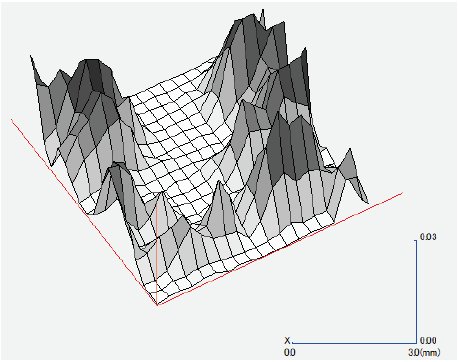
Figure 7: Mapping analysis results by 3D Bird Viewer; X-ray intensities of K Kα line.
Conclusions
Rigaku ZSX Primus IV (tube-above) and ZSX Primus IVi (tube-below), which are general purpose sequential wavelength dispersive XRF spectrometers, are capable of point and mapping analysis with small-spot measurement, down to 0.5 mm in diameter.
ZSX Primus IV / Primus IVi have a sample stage that moves a specimen to a specified position; therefore, it is possible to measure any point on the surface of the specimen under the same optical conditions, which enables accurate quantitative, semi-quantitative (standardless) and qualitative analysis for a small spot. ZSX Primus IV / Primus IVi can be equipped with a digital camera. On a digital image captured by the camera, point(s), a line or an area (mapping) for small-spot measurement of a specimen can be specified.
With ZSX Primus IV and ZSX Primus IVi, it is possible to quickly check inclusions/defects or inhomogeneity on samples without any complex sample preparation, such as EPMA method, as well as conduct daily routine analysis with large-measurement area (e.g. 30 mm in diameter).

Contact Us
Whether you're interested in getting a quote, want a demo, need technical support, or simply have a question, we're here to help.