Thaumatin S-SAD Phasing with 2 hours of Data Collection on the XtaLAB Synergy-S
Introduction
We recently introduced a sealed-tube 4-circle diffractometer for small molecule and macromolecular crystallography, the XtaLAB Synergy-S. It features three new technologies in a compact cabinet that will fit into any home laboratory: microfocus PhotonJet-S sources (with Cu, Mo, or Ag targets), an ultrafast (10° per second) Kappa goniometer, and a HyPix-6000HE hybrid photon counting detector with 0.1 mm by 0.1 mm pixels. Here, we collected a two-hour data set on a thaumatin crystal to demonstrate the quality of data from the XtaLAB Synergy-S system using a protein crystal with an average size unit cell.
Experimental overview
T. daniellii thaumatin was purchased from Sigma and suspended in ultrapure, laboratory grade water to a concentration of 50 mg/ml. Crystals of thaumatin were grown at 18˚C from hanging drops consisting of 6 μL of 50 mg/ml thaumatin plus 4 μL of crystallization solution [24% (w/v) NaKTartrate, 15% (v/v) ethylene glycol, and 0.1 M BisTris Propane, pH 6.6] over a well containing 500 μL of crystallization solution. Prior to flash-cooling, each crystal was soaked for ~15 to 30 seconds in the above crystallization solution at 25% (v/v) ethylene glycol for cryoprotection. The XtaLAB Synergy-S system and detector specifications are listed in Table 1.
Table 1: XtaLAB Synergy-S specifications.
| X-ray source | PhotonJet-S Cu source with continuously variable divergence slit Beam size = 100 µm |
| Operating power | 50 kV x 1 mA = 50 W |
| Goniometer / Detector range | 4- circle Kappa with telescoping 2θ arm / distance range of 30 – 250 mm |
| Detector Active area Readout time Pixel size Cooling |
Hybrid photon counting HyPix-6000HE 77.5 x 80.3 mm Continuous (7 ns) 100 µm air-cooled |
Data collection was performed using CrysAlisPro, processing was performed using XDS¹, and structure solution was performed using various programs through HKL-3000R². A large (0.6 mm x 0.3 mm x 0.3 mm) thaumatin crystal was selected for data collection to illustrate the worst-case scenario for spot spread due to beam divergence (Figure 1).
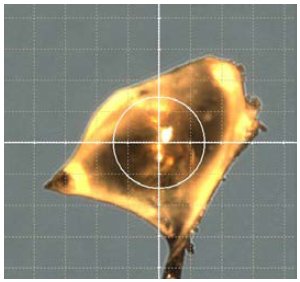
Figure 1: Thaumatin crystal. Grid spacing is 0.1 mm. Circle is 0.3 mm.
Results
The thaumatin crystal diffracted to beyond 2 Å and auto-indexing revealed a primitive, tetragonal unit cell a = b = 57 Å and c = 149 Å. Spot separation along the longest primitive cell edge was achieved using the full divergence of the X-ray beam and a detector distance of 60 mm (Figure 2).
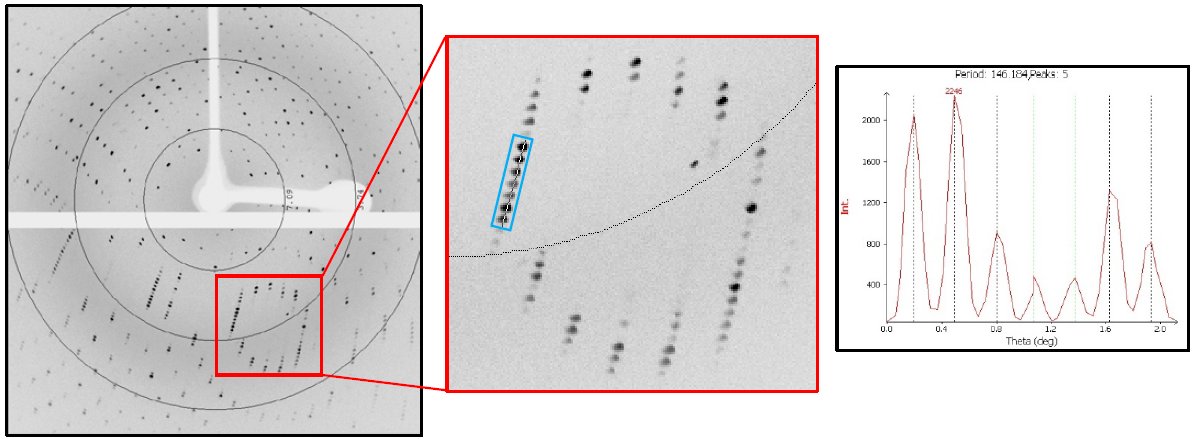
Figure 2: 20-second exposure per 0.2° rotation of the thaumatin crystal at distance of 60 mm on the HyPix-6000HE. The resolution rings are 7.09, 3.74, and 2.68 Å. Zoomed in panel shows lunes along the 150 Å cell edge. Peak separation and d-spacing of spots boxed in blue is shown in the plot at right.
Six scans, calculated by the strategy algorithm of CrysAlisPro, were collected to achieve complete, redundant data to 1.4 Å in 2 hours (Table 2).
Table 2: Scans collected on thaumatin.
| Scan # | ω start | ω range | Δω | φ | κ | 2θ | No. img | Time/img | Total exposure |
| 1 | -136° | 186° | 0.15° | -180° | 0° | -37.8° | 1240 | 2s | 41m 20s |
| 2 | 55° | 37.95° | 0.15° | 84° | -171° | 36.9° | 253 | 2s | 8m 26s |
| 3 | 60° | 64.05° | 0.15° | -150° | 178° | 36.9° | 427 | 2s | 14m 14s |
| 4 | -27° | 27° | 0.15° | -97.7° | 112° | 36.9° | 180 | 2s | 6m |
| 5 | -119° | 118.05° | 0.15° | 30° | -57° | -37.8° | 787 | 2s | 26m 14s |
| 6 | -58° | 108° | 0.15° | -30° | -19° | -37.8° | 720 | 2s | 24m |
| 2h 14s | |||||||||
Table 3 shows the results of data processing. The data were scaled to 1.4 Å treating the Friedel pairs as different reflections because the high redundancy allowed it. This resulted in a 100% complete data set with an Rmerge under 10%. To locate the 17 sulfur sites and phase the data, SHELXD³ was run for 500 trials and the best solution had a CCAll = 25.1, CCWeak = 11.4, PATFOM = 0.93, and 14 sites with high occupancy. The 14 sites were used in phasing to 1.5 Å with SHELXE, refinement of sites and phase improvement with MLPHARE⁴, and density modification and phase extension to 1.4 Å with DM⁵. The Figure of Merit after density modification was 0.87. From the anomalous difference Fourier, 2 additional sulfur sites were picked up and the phasing process repeated. The phases were handed to ARP/wARP⁶ for 2 cycles of automated model building which produced an initial model containing 205 aa. This model was manually adjusted in Coot⁷ and refined for 10 cycles with Refmac⁸ which gave an R = 15.0% and an Rfree = 16.2%. Figure 3 shows the model and maps near R53.
Table 3: Crystal parameters and processing statistics for Thaumatin with Friedel pairs unmerged.
| Space group | P4₁2₁2 |
| Unit cell (Å) | 57.8, 57.8, 149.8 |
| Resolution (Å) (last shell) | 20-1.4 (1.44-1.40) |
| Total # reflections | 698447 |
| Unique # reflections | 95481 |
| Completeness (%) (last shell) | 99.9 (100) |
| Multiplicity (last shell) | 7.3 (5.2) |
| <I/σ(I)> (last shell) | 19.6 (1.7) |
| Rmerge (%) (last shell) | 7.3 (88.8) |
| CC½ (last shell) | 99.9 (57.7) |
| R / Rfree (%) | 15.0 / 16.2 |
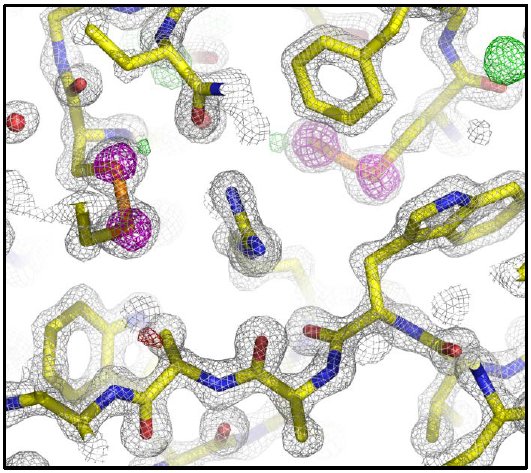
Figure 3: 2Fo-Fc (grey mesh @ 2 rmsd), Fo-Fc (green and red meshes @ 3 and -3 rmsd, respectively), and anomalous difference (magenta mesh @ 5 rmsd) electron density maps. R53 is in the center flanked by two disulfide bonds.
Conclusion
The crystal structure of T. daniellii thaumatin was solved by S-SAD phasing to 1.4 Å using a data set collected in 2 hours on the XtaLAB Synergy-S system. This solution was possible in such a short time because of the high flux and brilliance of the system combined with the speed, accuracy, and precision of the ultrafast goniometer and HyPix-6000HE detector.
References
- Kabsch, W. (2010) Acta Cryst. D66, 125-132.
- Minor W., Cymborovski, M., Otwinowski, Z., & Chruszcz, M. (2006) Acta Cryst. D62, 859-866.
- Sheldrick, G.M. (2008) Acta Cryst. D64, 112-122.
- Otwinowski, Z. (1991) Proceedings of the CCP4 Study Weekend.
- Cowtan K. (1994) Joint CCP4 and ESF-EACBM Newsletter on Protein Crystallography 31, 34-38.
- Langer G., Cohen S.X., Lamzin V.S. & Perrakis A. (2008) Nature Protocols 3, 1171-1179.
- Emsley, P., Lohkamp, B., Scott, W.G. & Cowtan, K. (2010) Acta Cryst. D66, 486-501.
- Murshudov G.N., Vagin, A.A. & Dodson, E.J. (1997) Acta Cryst. D53, 240-255.

Contact Us
Whether you're interested in getting a quote, want a demo, need technical support, or simply have a question, we're here to help.