Lysozyme S-SAD Phasing with Two Minutes of Data Collection on the XtaLAB Synergy-Custom
Introduction
A modern, home laboratory X-ray diffraction system with the latest in photon counting detector technology should deliver high-quality data in a short amount of time. Rigaku Oxford Diffraction currently promotes the XtaLAB Synergy-Custom outfitted with a MicroMax™-007 HF rotating Cu anode, VariMax optics, ultrafast Kappa goniometer, and a HyPix-6000HE hybrid photon counting detector as the gold standard for a home laboratory X-ray diffraction system. To back up that claim, we present here the results of a 2.25-minute data collection on a 0.2 mm lysozyme crystal along with the sulfur SAD phasing of the data set.
Experimental overview
Lysozyme from chicken egg white (Sigma L6876) was suspended in 0.1 M NaOAc pH 4.4 to make a 40 mg/mL solution. Cryoprotected tetragonal crystals of lysozyme were grown at 18˚C from sitting drops consisting of 2 μL of lysozyme plus 2 μL of crystallization solution [7% NaCl, 0.1 M NaOAc pH 4.4, 18% ethylene glycol] over a well containing 400 μL of crystallization solution. All system specifications are listed in Table 1. Data collection and processing was performed using CrysAlisPro, and structure solution was performed using various programs through HKL-3000R¹. A picture of the mounted crystal is shown in Figure 1. Data collection temperature was 100 K.
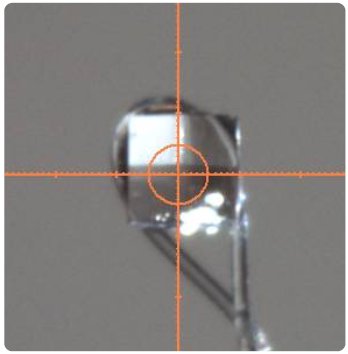
Figure 1: Lysozyme crystal. Grid spacing is 0.1 mm. Circle is 0.1 mm diameter.
Table 1: XtaLAB Synergy-S specifications.
| X-ray source | MicroMax-007HF Cu |
| Operating power | 40 kV x 30 mA = 1.2 kW |
| X-ray optic | Confocal VariMax VHF |
| Beam characteristics | FWHM = 100 μm, Divergence = 10 mrad (adjustable) Adjusted to 6 mrad here |
| Goniometer / Detector range | 4- circle Kappa with telescoping 2θ arm / distance range of 30 – 250 mm |
| Detector Active area Readout time Pixel size Cooling |
Hybrid photon counting HyPix-6000HE 77.5 x 80.3 mm Continuous (7 ns) 100 µm air-cooled |
Results
The lysozyme crystal diffracted to beyond 1.6 Å (Figure 2) and auto-indexing revealed a primitive, tetragonal unit cell a = b = 78 Å and c = 37 Å. The slit was adjusted to reduce the beam divergence to 6 mrad and reduce the size of the diffraction spots. Three scans, calculated by the strategy algorithm of CrysAlisPro, were collected to achieve complete, redundant data to 1.7 Å in two minutes (Table 2). The speed of data collection was 1.25° per second.
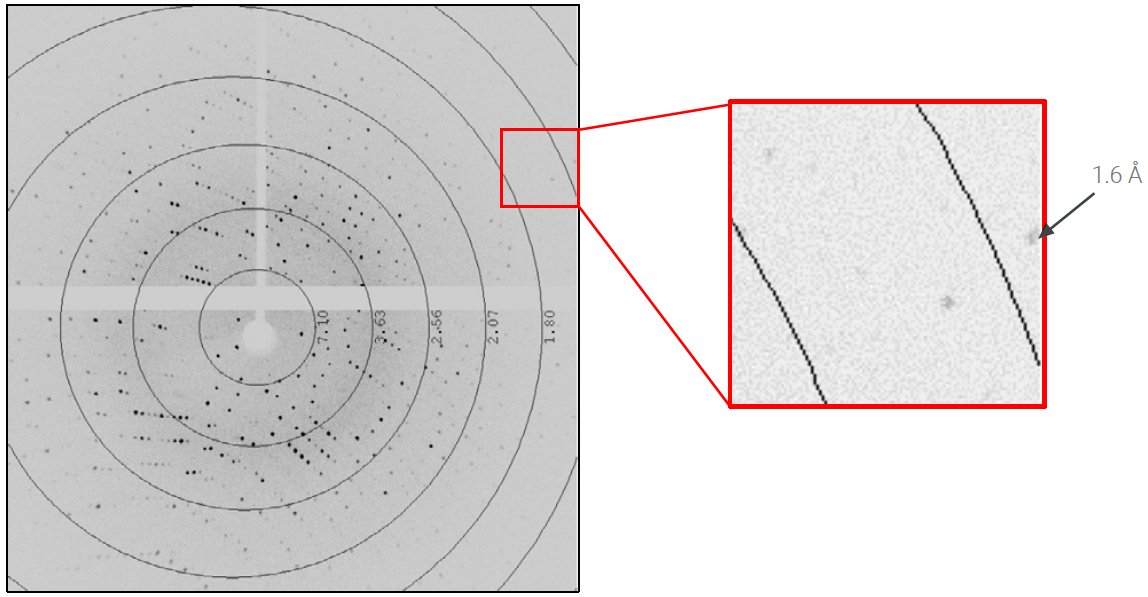
Figure 2: 0.2-second exposure per 0.25° rotation of the lysozyme crystal at distance of 35 mm.
Table 2: Scans collected on lysozyme at 35 mm
| Scan # | ωstart | ωend | Total rotation |
Δω | φ | κ | 2θ | # img. | Exp. per image |
Total exp. |
| 1 | -80° | 8° | 88° | 0.25° | -171° | -59° | -7.34° | 352 | 0.2s | 1m 10s |
| 2 | -11° | 40° | 51° | 0.25° | -90° | -99° | 6.403° | 204 | 0.2s | 41s |
| 3 | -11° | 21.5° | 32.5° | 0.25° | 60° | -99° | 6.403° | 130 | 0.2s | 26s |
Table 3 shows the results of data processing with CrysAlisPro followed by scaling to 1.6 Å with AIMLESS². This resulted in a 97.5% complete data set with an Rmerge under 4% and an overall multiplicity of 8.5. To locate the 10 sulfur sites and phase the data, SHELXD³ was run for 1000 trials and the best solution had a CCAll = 24.0, CCWeak = 10.0, PATFOM = 1.31, and 14 sites with high occupancy (some of the sites are chloride ions). The 14 sites were used in phasing to 1.7 Å with SHELXE, refinement of sites and phase improvement with MLPHARE⁴, and density modification and phase extension to 1.6 Å with DM⁵. The Figure of Merit after density modification was 0.81. The phases were passed to ARP/wARP⁶ for three cycles of automated model building, which produced an initial model containing 129 aa. This model was manually adjusted in Coot⁷ and refined for 10 cycles with Refmac5⁸, which gave an R = 15.3% and an Rfree = 17.9%. Figure 3 shows the model and maps.
Table 3: Crystal parameters and processing statistics for lysozyme
| Space group | P4₃2₁2 |
| Unit cell (Å) | 78.8, 78.8, 36.8 |
| Resolution (Å) (last shell) | 26.27 – 1.6 (1.63 – 1.60) |
| Total # reflections | 132191 |
| Unique # reflections | 15466 |
| Completeness (%) (last shell) | 97.5 (75.9) |
| Multiplicity (last shell) | 8.5 (2.8) |
| <I/σ(I)> (last shell) | 34.3 (6.3) |
| Rmerge (%) (last shell) | 3.8 (15.7) |
| CC½(last shell) | 100 (96.8) |
| R / Rfree (%) | 15.3 / 17.9 |
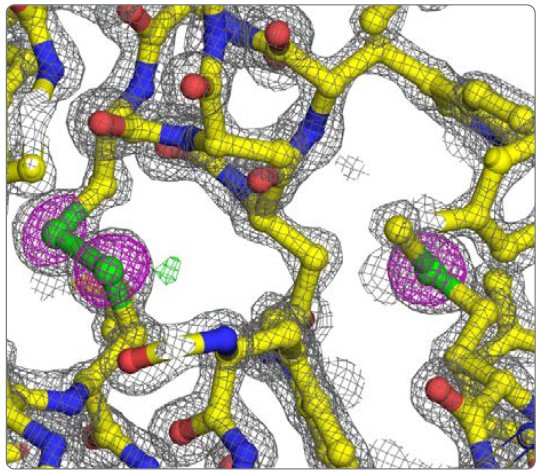
Figure 3: Detail of lysozyme refined model. 2Fo-Fc (grey mesh @ 2 rmsd), Fo-Fc (green and red meshes @ 3 and -3 rmsd, respectively), and anomalous difference (magenta mesh @ 5 rmsd) electron density maps. The disulfide between Cys 115 and 30 is on the left and Met 105 is on the right.
Conclusion
The crystal structure of hen egg white lysozyme was solved by S-SAD phasing to 1.6 Å using a data set collected in 2.25 minutes on the XtaLAB Synergy-Custom system with a MicroMax-007 HF source. This solution was possible in such a short time because of the high flux and brilliance of the system combined with the speed, accuracy, and precision of the ultrafast goniometer and HyPix-6000HE detector.
References
- Minor W., Cymborovski, M., Otwinowski, Z., & Chruszcz, M. (2006) Acta Cryst. D62, 859-866.
- Evans, P.R. & Murshudov, G.N. (2013) Acta Cryst. D69, 1204-1214.
- Sheldrick, G.M. (2008) Acta Cryst. D64, 112-122.
- Otwinowski, Z. (1991) Proceedings of the CCP4 Study Weekend.
- Cowtan K. (1994) Joint CCP4 and ESF-EACBM Newsletter on Protein Crystallography 31, 34-38.
- Langer G., Cohen S.X., Lamzin V.S. & Perrakis A.(2008) Nature Protocols 3, 1171-1179.
- Emsley, P., Lohkamp, B., Scott, W.G. & Cowtan, K.(2010) Acta Cryst. D66, 486-501.
- Murshudov, G.N., Vagin, A.A. & Dodson, E.J. (1997) Acta Cryst. D53, 240-255.

Contact Us
Whether you're interested in getting a quote, want a demo, need technical support, or simply have a question, we're here to help.