Silicate Rock Analysis by Fusion Method
Introduction
Major and trace component profiles in igneous rocks provide much information about rock history such as eruption or solidification, magma evolution, magma genesis and source materials as well as petrographical classification. In modern petrology, accurate determination of major and trace elements in silicate rocks is essential. Elemental analysis of rocks requires high precision, sensitivity and high throughput. X-ray fluorescence spectrometry is suitable for such requirements in silicate rock analysis. For the determination of major elements in silicate rocks, XRF analysis is currently a standard analytical method as well as the traditional wet chemical technique.
For quantitative analysis of geological samples, the fusion method is common, which can eliminate sample heterogeneity, such as particle size and mineralogical effects, caused by various rock-forming minerals. Conventional fusion method have been widely used for determination of major element concentration because dilution by flux significantly reduces sensitivities of trace elements. Pressed pellet method is, therefore, applied to trace element analysis. Applying two preparation methods for every sample is not efficient and time-consuming. Low dilution fusion method has been developed to improve sensitivity of trace elements. The technique enables to determine the concentrations of trace elements accurately as well as major elements by a fused bead alone.
This note demonstrates the low dilution fusion method to determine chemical concentrations for both major and trace elements in silicate rocks using ZSX Primus III+.
Instrument
The ZSX Primus III+ is a floor-standing sequential wavelength dispersive X-ray fluorescence (WDXRF) spectrometer, which has advantages in high spectral resolution and high sensitivity in light elements. The instrument is designed to provide reliable analysis results and its flexibility provides multi purpose availability to wide range applications.
The ZSX Primus III+ is equipped with a 3 kW Rh target X-ray tube. Analyzing crystals (up to 10 crystals) can cover from beryllium to uranium.
The instrument also has a built-in intelligent auto sample changer (ASC). The ASC is upgradable to 48 samples for high demand processes.
The ZSX Primus III+ has a unique optical configuration designed to minimize errors caused by surface condition of samples. Therefore, it is possible to measure with high precision and accuracy fused beads in which the surface becomes curved with deformation of platinum crucibles by continuous fusion operation. The software is further improved regarding easy-to-use operation for users who are not experienced. In particular, the flowbar system fully supports operation on the setting-up of quantitative analysis
Standard and sample preparation
The standard samples used for calibration were 14 certified reference materials (CRM’s) supplied from the Geological Survey of Japan (GSJ). These standards are composed of basic to acidic igneous rocks. Range of SiO₂ content in these CRMs is wide from 43.6 to 76.8 in mass%.
The well-dried (2 hours at 105°C) samples were fused with flux (Flux100B) in the ratio 1:2 by a fusion machine.
Measurement and calibration method
The ZSX Primus III+ with a 3 kW Rh target X-ray tube was used to measure both major and trace elements. Each measurement was performed at the tube condition of 3 kW. All of the trace elements were measured with primary beam filter to improve detection limit.
Matrix correction coefficients (alphas) applied to the matrix correction in the calibration were theoretically calculated by built-in fundamental parameter (FP) software. In the calculation of the theoretical alphas, ignition loss was set as balance component.
Results
The calibration curves for major elements are shown in Figure 1.
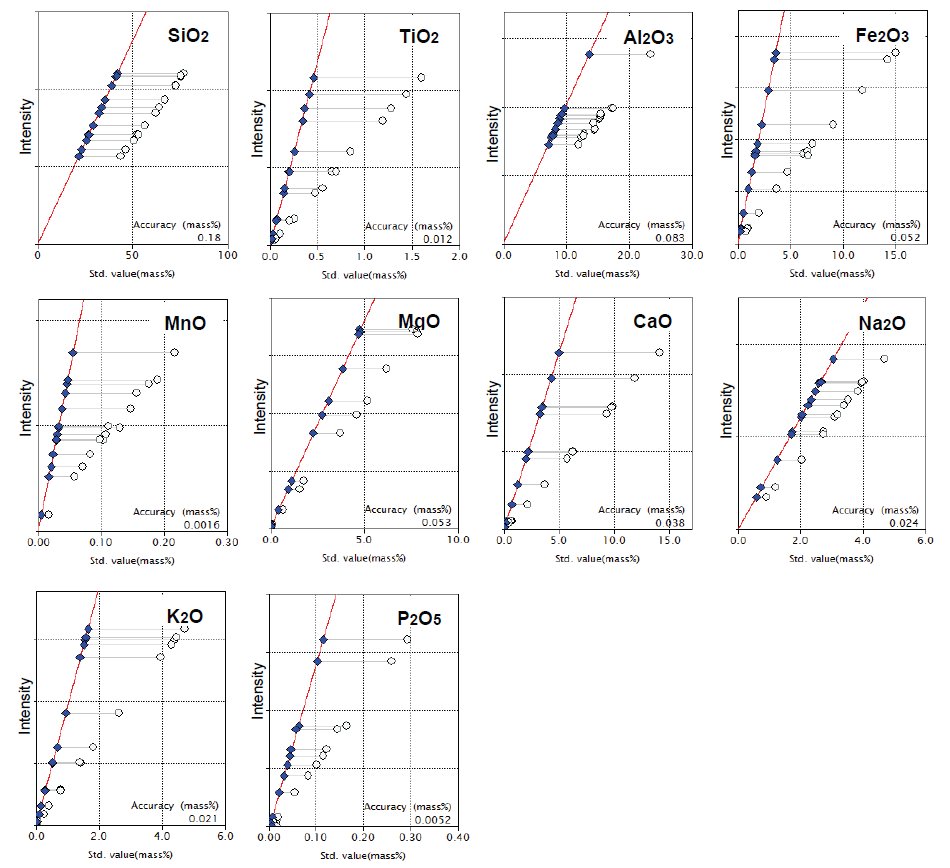
Figure 1: Calibration curves of major components. Open circle: uncorrected point; Solid diamond: corrected point
Accuracy of calibration in SiO₂ is less than 0.2 mass% in such a wide concentration range as shown in the calibration graph. Other calibrations also show excellent accuracy. The accuracy of calibration is calculated by the following formula:
$Accuracy = \sqrt{ \frac{\sum_i{(C_i-\hat{C}_i)^2}}{n-m} }$
$C_i$: calculated value of standard sample
$\hat{C}_i$: reference value of standard sample
n : number of standard samples.
m: degree of freedom (linear 2, quad. 3)
Typical lower limit of detection (LLD) and typical accuracy of calibration curve for each trace element are shown in Table 1. The LLDs are calculated as follows:
$LLD = 3 \cdot \frac{1}{m} \cdot \sigma_B = 3 \cdot \frac{1}{m} \cdot \sqrt{\frac{I_B}{1000 \cdot t}}$
$m$ : sensitivity of calibration (kcps/mass%)
$σ_B$ : standard deviation of blank intensity (kcps)
$I_B$ : intensity of the blank (kcps)
$t$ : counting time (s); 100 s is used
Table 1: Typical LLD and accuracy of calibration curve for trace elements (unit : ppm)
| Component / Element | Typical LLD (100s, 3σ) | Typical accuracy |
| Ba | 4.5 | 9.8 |
| Ce | 2.7 | 4.4 |
| Co | 0.2 | 1.0 |
| Cr | 0.5 | 4.3 |
| Cu | 0.3 | 6.2 |
| Ga | 0.2 | 0.6 |
| La | 3.3 | 4.2 |
| Nb | 0.6 | 0.8 |
| Nd | 4.6 | 2.2 |
| Ni | 0.2 | 3.4 |
| Pb | 0.2 | 0.8 |
| Rb | 0.2 | 3.5 |
| Sc | 1.0 | 2.7 |
| Sm | 3.1 | 1.6 |
| Sr | 0.1 | 4.5 |
| Th | 0.2 | 1.2 |
| V | 0.8 | 3.1 |
| Y | 0.1 | 0.7 |
| Yb | 1.8 | 1.4 |
| Zn | 0.2 | 2.0 |
| Zr | 0.1 | 5.7 |
To demonstrate instrumental precision, 20 measurements were performed with certified reference material JB-1a (basalt). The results of average and standard deviation of each component are shown in Table 2.
Table 2: Result of precision test
| Component / Element | Certified value | Average of 20 measurements | Std. dev. | RSD% |
| SiO₂ (mass%) |
52.41 | 52.63 | 0.045 | 0.086 |
| TiO₂ (mass%) |
1.28 | 1.30 | 0.004 | 0.27 |
| Al₂O₃ (mass%) |
14.45 | 14.44 | 0.017 | 0.12 |
| T.Fe₂O₃ (mass%) |
9.05 | 8.99 | 0.006 | 0.063 |
| MnO (mass%) |
0.148 | 0.147 | 0.0006 | 0.43 |
| MgO (mass%) |
7.83 | 7.77 | 0.022 | 0.28 |
| CaO (mass%) |
9.31 | 9.36 | 0.006 | 0.066 |
| Na₂O (mass%) |
2.73 | 2.75 | 0.021 | 0.76 |
| K₂O (mass%) |
1.4 | 1.4 | 0.002 | 0.16 |
| P₂O₅ (mass%) |
0.26 | 0.26 | 0.002 | 0.62 |
| Ba | 504 | 511 | 8.4 | 1.6 |
| Ce | 65.9 | 60 | 1.9 | 3.2 |
| Co | 38.6 | 37 | 0.70 | 1.9 |
| Cr | 392 | 393 | 2.4 | 0.62 |
| Cu | 56.7 | 55 | 0.60 | 1.1 |
| Ga | 17.9 | 18 | 0.40 | 2.2 |
| La | 37.6 | 33 | 2.0 | 5.9 |
| Nb | 26.9 | 26 | 0.32 | 1.2 |
| Nd | 26 | 26 | 1.4 | 5.2 |
| Ni | 139 | 133 | 0.75 | 0.56 |
| Pb | 6.76 | 8 | 0.54 | 7.1 |
| Rb | 39.2 | 38 | 0.44 | 1.2 |
| Sc | 27.9 | 29 | 1.8 | 6.0 |
| Sm | 5.07 | 6 | 0.87 | 15 |
| Sr | 442 | 447 | 0.81 | 0.18 |
| Th | 9.03 | 8 | 0.57 | 6.9 |
| V | 205 | 203 | 2.4 | 1.2 |
| Y | 24 | 24 | 0.27 | 1.1 |
| Yb | 2.1 | 2 | 0.47 | 19 |
| Zn | 82.1 | 82 | 0.54 | 0.66 |
| Zr | 144 | 136 | 0.45 | 0.33 |
Conclusions
X-ray fluorescence spectrometry is rapid, precise and accurate method to meet the requirements of silicate rock analysis. It can also minimize the requirement of analytical skill and save analysis time in the sample preparation compared to other spectroscopic analysis methods which use wet chemical technique.
This note demonstrates that XRF analysis with low dilution fusion method applied to trace elements can widely cover from compatible to incompatible trace elements, containing some rare earth elements with high accuracy.
Thus, X-ray fluorescence spectrometer with high reliability and stability such as ZSX Primus III+ are essential instruments to determine chemical property of geological samples in the geological research laboratories and institutes.

Contact Us
Whether you're interested in getting a quote, want a demo, need technical support, or simply have a question, we're here to help.