Quantitative Analysis of Aluminum Alloy on Supermini200
Introduction
Aluminum alloy, which has the valuable properties of being both “light” and “strong”, is used in many industries such as automobile and aircraft. Since aluminum alloy has a broad range of grades whose characteristics are strongly dependent on the elemental compositions, it is very important to control the components. X-ray fluorescence (XRF) analysis quickly and easily offers precise elemental analysis results to make control of the components in aluminum alloy possible. This application note demonstrates the excellent performance of Supermini200 in aluminum alloy analysis.
Instrument
The Supermini200 is a benchtop sequential WDXRF spectrometer designed specifically to deliver excellent performance while eliminating typical installation requirements such as cooling water, special power supply, large floor space, and gas-free detector (in selecting the optional sealed proportional counter instead of the gas-flow proportional counter).
Featuring a unique air-cooled 200W X-ray tube, two detectors, selectable vacuum or helium environment, and three analyzing crystals, the Supermini200 can analyze elements from oxygen to uranium.
The Windows®-based software used to operate the Supermini200 shares the same platform running Rigaku’s popular high-power WDXRF ZSX family instruments. This means that it has the same advanced algorithms, multiple language support and an intuitive user-friendly interface.
Sample preparation
In XRF analysis, homogeneous samples with smooth analysis surfaces generally produce better results. Some grades of aluminum alloys, however, can be inhomogeneous (Figure 1). In such cases, smooth polishing can result in less accurate results, especially for Si, and it is preferable to use a rough belt grinder or file to polish to a rough surface.
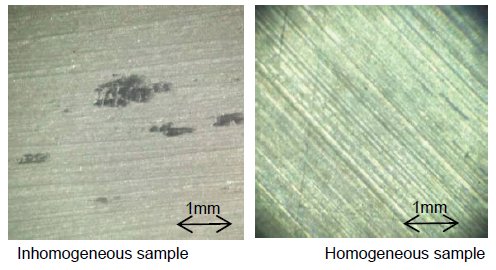
Figure 1: Aluminum alloy sample surface (microscope image)
Measurement and calibration
Measurements were performed on the Supermini200 for Mg, Si, Ti, Cr, Mn, Fe, Ni, Cu, Zn, Sn and Pb. For the measurement of Sn, a zirconium filter was used to reduce the background to improve the peak to back-ground ratio. Measurement conditions are shown in Table 1.
Table 1: Measurement condition
| Element | Mg | Si | Ti | Cr |
| Line | Kα | Kα | Kα | Kα |
| kV-mA | 50-4.00 | 50-4.00 | 50-4.00 | 50-4.00 |
| Primary Filter | OUT | OUT | OUT | OUT |
| Slit | Std | Std | Std | Std |
| Crystal | RX25 | PET | LiF(200) | LiF(200) |
| Detector | PC | PC | SC | SC |
| Time Peak (s) | 20 | 20 | 100 | 30 |
| BG(s) | 20 | 10x2 | 20x2 | 10x2 |
| Element | Mn | Fe | Ni | Cu |
| Line | Kα | Kα | Kα | Kα |
| kV-mA | 50-4.00 | 50-4.00 | 50-4.00 | 50-4.00 |
| Primary Filter | OUT | OUT | OUT | OUT |
| Slit | Std | Std | Std | Std |
| Crystal | LiF(200) | LiF(200) | LiF(200) | LiF(200) |
| Detector | SC | SC | SC | SC |
| Time Peak (s) | 20 | 20 | 20 | 20 |
| BG(s) | 10x2 | 10x2 | 10x2 | 10x2 |
| Element | Zn | Sn | Pb | |
| Line | Kα | Kα | Lβ1 | |
| kV-mA | 50-4.00 0 | 50-4.00 | 50-4.00 | |
| Primary Filter | OUT | Zr200 | OUT | |
| Slit | Std | Std | Std | |
| Crystal | LiF(200) | LiF(200) | LiF(200) | |
| Detector | SC | SC | SC | |
| Time Peak (s) | 20 | 50 | 20 | |
| BG(s) | 10x2 | 10x2 | 10x2 |
The calibration curves were generated using ALCOA spectrochemical standards KA332, KB413, KB514, KC413, SS332, SS380, SS384, SS413 and SS513. Matrix correction was applied to all calibration curves. The correction coefficients were calculated theoreti-cally by the fundamental parameter (FP) method. The calibration curves are shown in Figure 2 and the calibration results are listed in Table 2.
%20%20Calibration%20curves%20for%20Al%20alloy%20.jpg?width=495&height=769&name=XRF1055%20Figure%203%20(part%201)%20%20Calibration%20curves%20for%20Al%20alloy%20.jpg)
%20%20Calibration%20curves%20for%20Al%20alloy%20.jpg?width=495&height=775&name=XRF1055%20Figure%203%20(part%202)%20%20Calibration%20curves%20for%20Al%20alloy%20.jpg)
Figure 2: Calibration curves for Al alloy
Table 2: Calibration results (unit : mass%)
| Element | Calibration range | Accuracy |
| Mg | 0.001 - 4.50 | 0.017 |
| Si | 0.20 - 12.60 | 0.47 |
| Ti | 0.030 - 0.14 | 0.0029 |
| Cr | 0.001 - 0.05 | 0.0011 |
| Mn | 0.061 - 0.39 | 0.01 |
| Fe | 0.10 - 1.22 | 0.015 |
| Cu | 0.020 - 3.61 | 0.016 |
| Ni | 0.034 - 2.78 | 0.013 |
| Zn | 0.08 - 1.82 | 0.0035 |
| Sn | 0.001 - 0.12 | 0.0019 |
| Pb | 0.001 - 0.12 | 0.0039 |
The accuracy of the linear calibration curves are calculated by the following formula:
$Accuracy = \sqrt{ \frac{\sum_i{(C_i-\hat{C}_i)^2}}{n-2} }$
$C_i$: calculated value of standard sample
$\hat{C}_i$: reference value of standard sample
n : number of standard samples.
Table 3: Repeatability test results for ALCOA KA380 (unit : mass%)
| Element | Mg | Si | Ti | Cr | Mn | Fe | Cu | Ni | Zn | Sn | Pb |
| Certified value | 0.45 | 9.49 | 0.120 | 0.062 | 0.16 | 1.1 | 3.10 | 0.45 | 0.15 | 0.20 | 0.11 |
| N=1 | 0.428 | 10.05 | 0.113 | 0.058 | 0.153 | 1.09 | 3.12 | 0.439 | 0.148 | 0.197 | 0.105 |
| 2 | 0.436 | 10.06 | 0.114 | 0.060 | 0.153 | 1.09 | 3.11 | 0.440 | 0.148 | 0.195 | 0.105 |
| 3 | 0.430 | 10.03 | 0.116 | 0.057 | 0.155 | 1.09 | 3.12 | 0.440 | 0.150 | 0.195 | 0.104 |
| 4 | 0.432 | 10.04 | 0.114 | 0.058 | 0.153 | 1.09 | 3.12 | 0.439 | 0.149 | 0.198 | 0.105 |
| 5 | 0.432 | 10.04 | 0.114 | 0.057 | 0.155 | 1.09 | 3.12 | 0.438 | 0.149 | 0.199 | 0.106 |
| 6 | 0.428 | 10.04 | 0.113 | 0.059 | 0.154 | 1.10 | 3.12 | 0.439 | 0.149 | 0.198 | 0.106 |
| 7 | 0.427 | 10.05 | 0.114 | 0.058 | 0.152 | 1.09 | 3.12 | 0.442 | 0.149 | 0.196 | 0.105 |
| 8 | 0.427 | 10.06 | 0.115 | 0.058 | 0.154 | 1.09 | 3.13 | 0.440 | 0.149 | 0.198 | 0.104 |
| 9 | 0.423 | 10.03 | 0.114 | 0.058 | 0.155 | 1.09 | 3.11 | 0.439 | 0.149 | 0.197 | 0.106 |
| 10 | 0.428 | 10.00 | 0.113 | 0.056 | 0.153 | 1.09 | 3.11 | 0.441 | 0.149 | 0.195 | 0.105 |
| Avg. | 0.429 | 10.04 | 0.114 | 0.058 | 0.154 | 1.09 | 3.12 | 0.440 | 0.149 | 0.197 | 0.105 |
| Max. | 0.436 | 10.06 | 0.116 | 0.060 | 0.155 | 1.10 | 3.13 | 0.442 | 0.150 | 0.199 | 0.106 |
| Min. | 0.423 | 10.00 | 0.113 | 0.056 | 0.152 | 1.09 | 3.11 | 0.438 | 0.148 | 0.195 | 0.104 |
| Range | 0.013 | 0.05 | 0.003 | 0.004 | 0.003 | 0.01 | 0.02 | 0.004 | 0.002 | 0.004 | 0.002 |
| Std. dev. | 0.0036 | 0.016 | 0.0009 | 0.0011 | 0.0011 | 0.003 | 0.005 | 0.0012 | 0.0006 | 0.0015 | 0.0007 |
| RSD % | 0.83 | 0.16 | 0.83 | 1.90 | 0.69 | 0.29 | 0.16 | 0.26 | 0.38 | 0.75 | 0.70 |
Analysis results
Repeatability tests for ALCOA spectrochemical standard KA380 were carried out and the results are tabulated in Table 3. The results are very close to the certified values and the standard deviations are very small.
Conclusions
The results show that high precision and accurate analysis of elements in aluminum alloy can be rapidly performed using the benchtop WDX Supermini200. Even inhomogeneous element such as Si can be analyzed accurately with an appropriate sample preparation. Supermini200 is also effective for small commercial laboratories where analysis of various alloys and other sample types are required.

Contact Us
Whether you're interested in getting a quote, want a demo, need technical support, or simply have a question, we're here to help.