Background
Standard analysis areas for XRF are somewhere between 30 and 40 mm in diameter. In an ideal world, every XRF sample would be perfectly smooth and flat with a polished or machined surface for a perfect fluorescence event to take place for optimal data output. Unfortunately, finding a sample in ideal condition or even large enough to ensure a homogenous reading across the whole 30 to 40mm measurement surface is very difficult. This is where having beam collimation or spot size selection capabilities, like those found in the Rigaku ZSX Primus II WD-XRF Spectrometer, becomes extremely useful.
Investigation
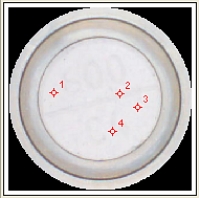
Due to the latest micro-analysis and mapping capabilities on the Primus II, a 0.5 mm or 500 micron spot size was selected for the following demonstration to show intensity disparities in less-than-ideal analysis conditions. A calcium vitamin supplement sample was used for the following data comparison. The actual sample and magnified images of all of the analysis spots can be seen below in Images 1, 2, and 3. Spot #1 has the most ideal placement on a flat and clean analysis area. Spots #2, #3, and #4 are all in less-than-ideal areas to show the intensity differences experienced in routine XRF analyses, without benefit of micro-analysis spot size selection.


In figures 1, 2 and 3, the data for all four analysis spots on the vitamin supplement for elemental calcium, magnesium, and sulfur content are shown in the charts of comparison. Spot #1 is represented by the blue line, spot #2 is the red line, spot #3 is the green line, and spot #4 is the black line in the following charts.

In figure 1, the calcium comparison shows that the heavier the element of interest is in the periodic chart, the greater the intensity difference is noted on a non-planar surface. Spots #2, #3 and #4 are all showing intensity attenuation, which would in turn produce falsely low results.

The situation in figure 2 shows the lightest of three analyzed elements, Magnesium with a smaller degree of difference in overall intensity. The red line from spot #2, or the analysis done on the most un-ideal surface of the four, has less intensity than the blue line from spot #1.

In figure 3, the less-than-ideal spot #2, now shows a much higher intensity than is expected (in blue line from spot #1) and would be expected to translate into falsely high results for the content of elemental Sulfur in the sample.
Conclusion
As expected, the intensity aberrations from the less-than-ideal analysis surfaces prove to give unreliable results, some being falsely low and others being falsely high. This random degree of error is known to exist and expected when unlevel samples are analyzed. Correction for this phenomenon is complicated, so the simplest fix would be to change your analysis area to the most ideal position and remove the unwanted error all together. This can be effectively done with the unique feature of Spot Micro-Analysis on the Rigaku ZSX Primus II WD-XRF Spectrometer.