How Are Texture and Pole Figures Measured?
Distribution of crystallographic orientations
In many cases, crystallographic texture (preferred orientation) can be introduced into a material during the fabrication process. For example, when steel sheets are rolled in the manufacturing process, a sheet texture is often produced. Since texture can affect a material's properties by introducing structural anisotropy, it is desirable to measure a material's texture.
The typical measurement to determine texture is called a pole figure. Traditional pole figure measurements are made by recording the intensity of a given Bragg reflection as a function of rotation and tilt of the sample. In an in-plane pole figure, the incident beam, sample rotation, and detector angle are all moved, eliminating the necessity to tilt the sample. The in-plane pole figure also allows a greater range of texture to be recorded, as it now contains the in-plane (sample surface) texture of the sample.
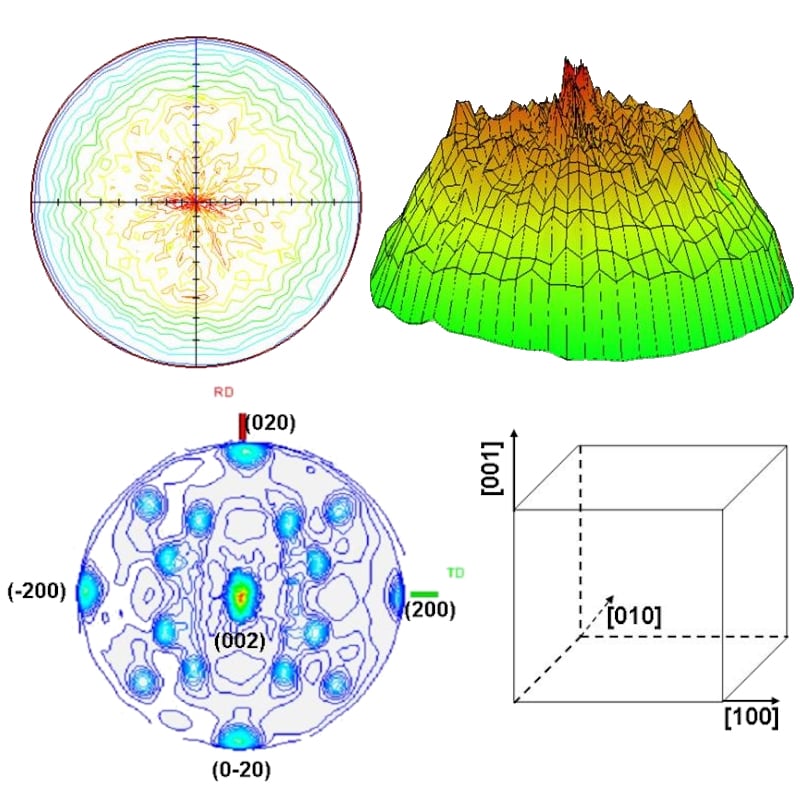
The top two diagrams above show an in-plane pole figure of the reflection for a rolled steel sheet sample. The central dark red portion indicates texture along the [211] direction. The figure shows the pole figure in both in stereographic projection (contour map) and 3D display. The bottom two diagrams show the (002) pole figure of a 50 micron thick Cu foil. The strong (002) peak at the center of the pole figure indicates that the foil is preferably (001)-oriented along the surface normal. The four peaks seen at the rim are Cu (200), (200), (020), and (020), respectively, due to the cubic structure of the copper lattices.

Contact Us
Whether you're interested in getting a quote, want a demo, need technical support, or simply have a question, we're here to help.