Application Note B-XRD1014
Introduction
Metals and ceramics are used in various fields of engineering endeavor including buildings, airplanes, automobiles, etc. In almost all of these applications the materials are polycrystalline and have a degree of texture, i.e. crystal orientation. The crystal orientation is typically derived as a result of materials processing stages such as forming and/or heat treatments. The crystal orientation can have a profound effect on thermal, electrical and mechanical properties. Hence analysis of the crystal orientation is crucial for controlling material properties. Crystal orientation can be determined from pole figures obtained by X-ray diffraction. Furthermore, from the analysis by the Crystallite Orientation Distribution Function (ODF) method, the volume fraction of the crystal orientation including other multiple orientations can be quantitatively obtained. In this example, the pole figure of Cu rolled sheet was measured and the volume fraction of crystal orientation was calculated.
Measurements and results
Crystal orientation is expressed as {hkl} <uvw>, meaning the crystallites have their {hkl} planes parallel to the sample surface and their <uvw> direction parallel to the rolling direction(1). The crystal orientation of the sample and its volume fraction can be obtained from the Defocus-corrected pole figure. The crystal orientation is determined by the stereo projection function, and the volume fraction of the crystal orientation including the other orientations are calculated by the ODF method. Defocus correction is used to correct the intensity decrease towards the outside of the pole figure for the diffraction intensity of the non-oriented specimen. Figure 1 shows the pole figure of Cu (220) obtained from the rolled sheet of Cu. From the pole figure obtained by the measurement of Cu (220), it is understood that the crystal orientation of {001} <010> indicated by □ marks exists. Figure 2 shows the ODF analysis. From this data, the volume fraction of highly probable crystal orientations was calculated from multiple pole figures such as Cu (111), (200) and (220). The volume fraction of crystal orientations was calculated from the Euler angular width and scale factor. .jpg?width=401&height=409&name=B-XRD1014%20Figure%201%20Pole%20figure%20of%20Cu(220).jpg)
Figure 1: Pole figure of Cu(220) – □ mark is the {001}<010> crystal orientation
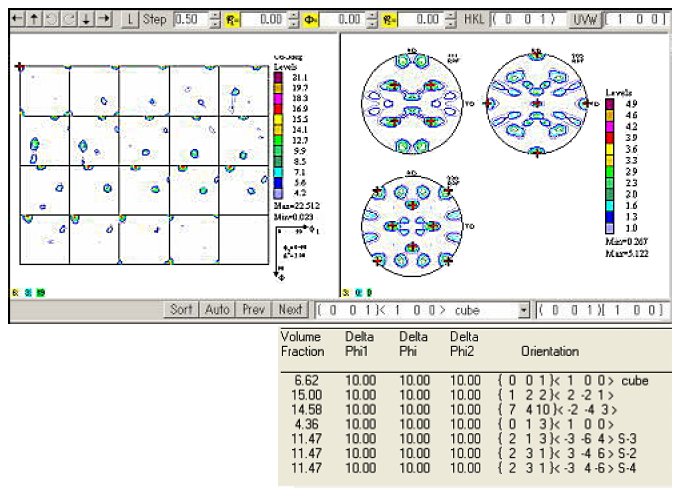 Figure 2: Results of ODF analysis and volume fraction determination.
References: (1) Keigo Nagao and Erina Kagami: Rigaku Journal (English version), 27(2) (2011) 1-8.
