Texture/stress of epi-layers
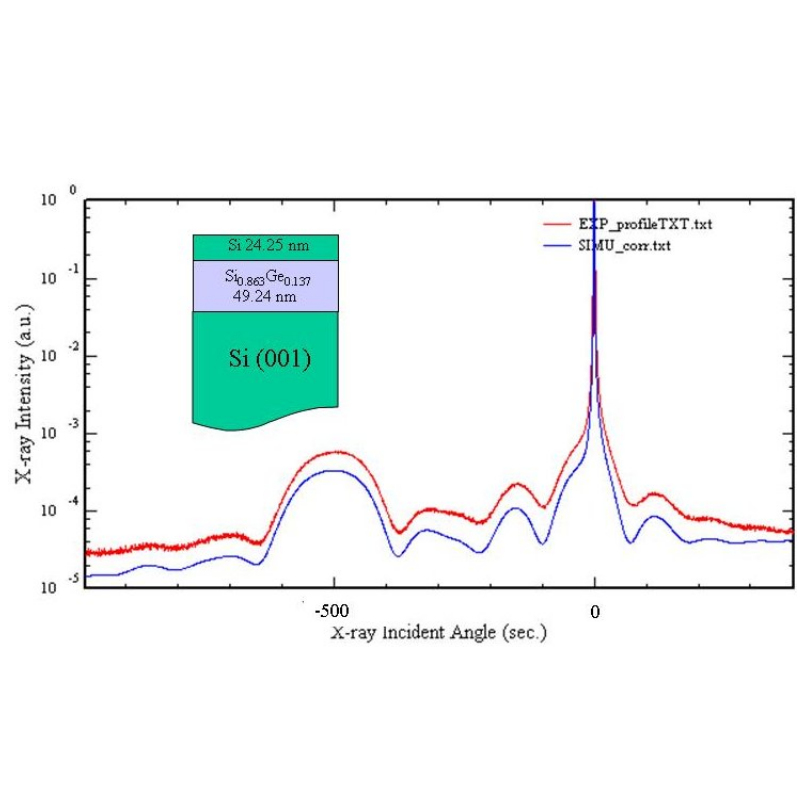
High resolution X-ray diffraction has long been used in the compound semiconductor industry for the characterization of epitaxial layers. Traditionally it has been used in the determination of thickness and composition of the epi-layers, but more recently the technique has advanced to enable the determination of strain and relaxation within a given layer of a multilayer structure. High-resolution X-ray rocking curves can be used to analyze the thickness, composition, and strain state of epitaxial single crystal films. Much of this information can be obtained by simulating and/or fitting the measured rocking curve using X-ray dynamical diffraction theory. In the image (at right), an SiGe film epitaxially grown on top of an Si (001) substrate along with an Si cap layer by molecular beam epitaxy (MBE) was analyzed. The nominal thickness and Ge concentration of the SiGe layer are 50 nm and 20.0%, respectively. The nominal cap layer thickness is 20 nm. The experimental rocking curve (red) was measured on the SmartLab multipurpose diffractometer with a Ge(440)x4 monochromator. The blue curve is the fitting result using Rigaku's rocking curve analysis software. The fit is in excellent agreement with the measured data. From the fitting, we learn that the SiGe layer is actually 49.24 nm with a Ge concentration of 13.7%. The Si cap layer thickness is 24.25 nm, slightly higher than the nominal value.
Rigaku recommends the following products:

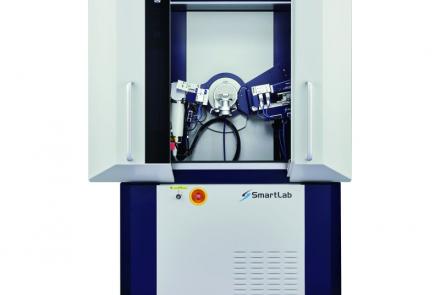
Advanced state-of-the-art high-resolution XRD system powered by Guidance expert system software
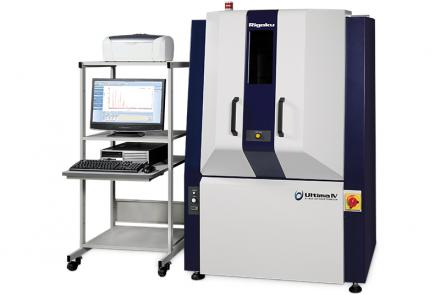
High-performance, multi-purpose XRD system for applications ranging from R&D to quality control